
Assignment 7
Prologue
This assignment can either be completed individually or with a partner of your choice. Be sure to review our Code of Conduct for pair programming and be careful to adhere to it when working on the assignment as a group. Keep in mind that you both must be authors of all code submitted.
Background
One of the most powerful applications of computer programming is the automation of statistical analysis. In particular, computer programs are used to process large quantities of data, summarize it, and visualize it so that the implications of the data can be understood. In this assignment, you will process and analyze a dataset and report any conclusions that can be extracted from it.
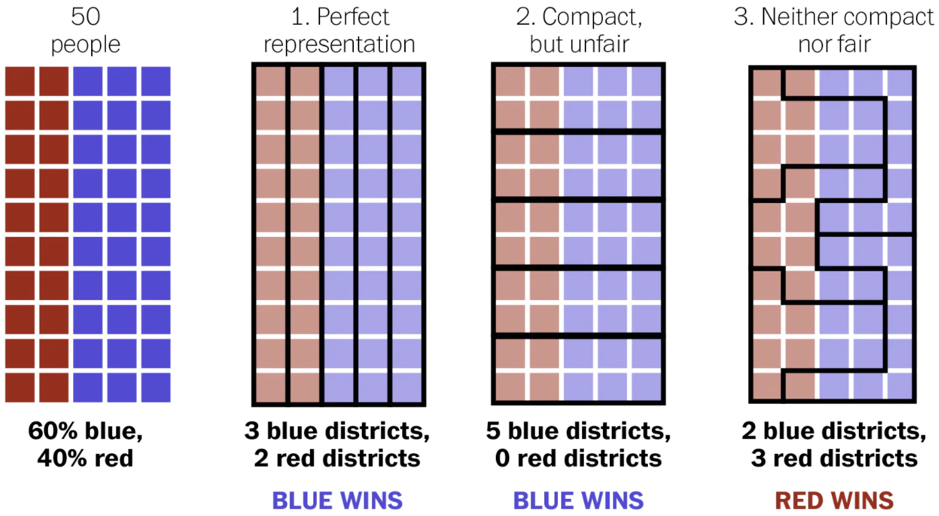
The issue you will explore is the practice of gerrymandering voting districts in U.S. elections. Gerrymandering is the manipulation of voting district boundaries to group voters in such a way to favor one political party over another. Below is a visual aid from the article How Gerrymandering Creates Unfair Elections in Singapore that discusses how gerrymandering can result in unfair elections.
For more information on gerrymandering, you can take a look at the following resources:
- One Way To Spot a Partisan Gerrymander
FiveThirtyEight, 2019 - Gerrymandering Explained
CGP Grey, 2011
In this assignment, you will process and examine the election data yourself and come to your own conclusion about the effects of gerrymandering in these elections.
Dataset
The dataset you will explore are the results of the 2018 US House of Representatives elections. The dataset was collected and published by the MIT Election Data and Science Lab and is publicly available on their Github page.
Start by downloading the CSV of the dataset below:
Create a file named gerrymandering.py and place the district_overall_2018.csv dataset and your gerrymandering.py file in the same folder. This will make the dataset easier to open and process during the assignment.
Be sure to examine the dataset carefully in Microsoft Excel or in your preferred spreadsheet viewer. Keep in mind that the first row of the CSV file is a header row and specifies what datum each column of the spreadsheet contains. The columns of particular interest to us are the state, the district, the party, and the candidate votes columns.
Part 1: Parsing the Data
In your gerrymandering.py file, write a function called parse_csv(filename) that takes the name of a file as a parameter and returns the dataset as a list. In particular, parse_csv should return a list of rows where each row is itself a list a strings. Each row list should have one element for each column of the CSV file. The parse_csv function should also skip the header row.
Below is an example of running this function on the district_overall_2018.csv dataset.
>>> table = parse_csv("district_overall_2018.csv")
>>> len(table)
1359
>>> table[0]
['2018', 'Alabama', 'AL', '1', '63', '41', 'U.S. Representative', 'District 1', 'gen', 'FALSE', 'Bradley Byrne', 'republican', 'FALSE', 'total', '153228', '242617', 'FALSE', '20190131']
>>> table[-1]
['2018', 'Wyoming', 'WY', '56', '83', '68', 'U.S. Representative', 'District 0', 'gen', 'FALSE', 'Richard Brubaker', 'libertarian', 'FALSE', 'total', '6918', '201245', 'FALSE', '20190131']
Here are a few tips on implementing this function:
- Open the file using the
openfunction. - Use the
readline()method of the file to skip the header row of the file. - Create an empty list named
table. - For each remaining row of the file, convert it into a list using the string
splitand append it to thetable. - Close the file using the
close()method. - Return the
table.
Part 2: Access Functions
Once you have parse_csv implemented, it is easy to parse the dataset into a list of lists. However, you’ll notice that it is now confusing to fetch columns from a row because you must access an element from a list by its index.
>>> table = parse_csv("district_overall_2018.csv")
>>> first_row = table[0]
>>> first_row[1]
'Alabama'
In your gerrymandering.py file, write four access functions named get_state(row), get_party(row), get_votes(row), and get_district(row). Each of these functions should take a list as a parameter representing a row from the table and return the corresponding column. Below is an example use of the functions:
>>> table = parse_csv("district_overall_2018.csv")
>>> first_row = table[0]
>>> get_state(first_row)
'Alabama'
>>> get_party(first_row)
'republican'
>>> get_votes(first_row)
153228
>>> get_district(first_row)
'District 1'
NOTE: Tthe get_votes function should return the candidate votes column, and should convert it into an integer since it is numerical.
Part 3: Filtering the Data
To properly analyze the dataset, we will need to be able to appropriately filter the rows based on their state and their party affiliation.
In your gerrymandering.py file, write two filtering functions named filter_by_state(table, state) and filter_by_party(table, party) that each take a list of rows as their first parameter and a string as their second parameter. The filter_by_state function should return all the rows in table that match the given state. Similarly, filter_by_party should return all the rows in table that match the given party.
NOTE: These filtering functions should return a new list of rows. Do not mutate the list table given as a parameter.
Below are example executions of these functions.
>>> table = parse_csv("district_overall_2018.csv")
>>> iowa = filter_by_state(table, "Iowa")
>>> len(iowa)
21
>>> iowa[0]
['2018', 'Iowa', 'IA', '19', '42', '31', 'U.S. Representative', 'District 1', 'gen', 'FALSE', 'Abby Finkenauer', 'democrat', 'FALSE', 'total', '170342', '334243', 'FALSE', '20190131']
>>> independents = filter_by_party(iowa, "independent")
>>> len(independents)
3
>>> independents[0]
['2018', 'Iowa', 'IA', '19', '42', '31', 'U.S. Representative', 'District 2', 'gen', 'FALSE', 'Daniel Clark', 'independent', 'FALSE', 'total', '1837', '312913', 'FALSE', '20190131']
Part 4: Grouping the Data
To help us process the data efficiently, we will need a way to quickly look up the election results for each district. In your gerrymandering.py file, write a function called group_by_district(table) that takes the table of data as a parameter and returns a dictionary that maps districts to rows of table. In particular, the dictionary returned should have one key for each district, and each key’s associated value should be the list of rows in table matching that district.
For example:
>>> table = parse_csv("district_overall_2018.csv")
>>> iowa = filter_by_state(table, "Iowa")
>>> districts = group_by_district(iowa)
>>> d2 = districts["District 2"]
>>> len(d2)
5
>>> d2[0]
['2018', 'Iowa', 'IA', '19', '42', '31', 'U.S. Representative', 'District 2', 'gen', 'FALSE', 'Christopher Peters', 'republican', 'FALSE', 'total', '133287', '312913', 'FALSE', '20190131']
Here are a few tips on implementing this function:
- Begin by creating an empty dictionary
{} - For each row of the table do the following:
- Find the district of the row with the
get_districtfunction - If the district is not already in the dictionary, initialize it with an empty list
- Append the row to the list corresponding to this district
- Find the district of the row with the
- Return the resulting dictionary
Part 5: Reducing the Data
Since we eventually want to quantitatively compare and contrast state and party voting results, we need functions that reduce the data into something we can reason about.
In this part, you will write four additional functions and place them in your gerrymandering.py file. The first two functions are:
get_total_votes(table): Returns the sum of all the votes intable. You can implement this function by iterating over all the rows oftable, use yourget_votesfunction to find the number of votes in the current row, and tally them all up, returning the overall total number of votes.get_percent_votes(table, party): Returns the fraction of votes thatpartyreceived in thetable. You can implement this by finding the number of votes associated withpartyand dividing by the total number of votes intable.
HINT: get_percent_votes can be implemented without using a for-loop by reusing your previously defined functions filter_by_party and get_total_votes.
Here is an example of using the above two functions:
>>> table = parse_csv("district_overall_2018.csv")
>>> iowa = filter_by_state(table, "Iowa")
>>> get_total_votes(iowa)
1316648
>>> get_percent_votes(iowa, "republican")
0.4650734288891184
>>> get_percent_votes(iowa, "democrat")
0.5048243721936311
The other two reduction functions you need to implement are:
find_highest_vote(table): Returns the row oftablewith the largest number of votes. This can be implemented by iterating over the rows oftableand keeping track of abest_so_farvariable that is the row with the highest number of votes seen so far. When your algorithm finishes iterating over the table, thebest_so_farwill have the row with the highest vote tally.get_percent_seats(table, party): Returns the fraction of district elections won bypartyin the table. This can be implemented using the following:- Use the
districts = group_by_district(table)function to group the rows oftableby their voting district. - Create a variable of how many districts have been won by
party, and initialize it to zero. - Iterate over each district in
districts, use yourfind_highest_votefunction to determine which row is the winner, and then useget_partyto check if the winner is the givenparty. If so, increment the tally from the previous step. - At the end of the function, return the percentage of how many districts were won by
party. You can calculate the total number of districts by usinglen(districts).
- Use the
Here is an example of using the above two functions:
>>> table = parse_csv("district_overall_2018.csv")
>>> iowa = filter_by_state(table, "Iowa")
>>> districts = group_by_district(iowa)
>>> d1 = districts["District 1"]
>>> find_highest_vote(d1)
['2018', 'Iowa', 'IA', '19', '42', '31', 'U.S. Representative', 'District 1', 'gen', 'FALSE', 'Abby Finkenauer', 'democrat', 'FALSE', 'total', '170342', '334243', 'FALSE', '20190131']
>>> get_percent_seats(iowa, "republican")
0.25
>>> get_percent_seats(iowa, "democrat")
0.75
Part 6: Analyzing the Data
Finally, we have what we need to analyze any discrepancy between number of votes and number of seats in state elections.
Write a main function in your gerrymandering.py file that asks the user to type in the name of a state and the name of a party and then prints off a summary of the total number of votes the party received and the number of districts won by that party.
When I “run” your gerrymandering.py file, it should produce output like the following:
What state are you interested in? Iowa
What party are you interested in? republican

In Iowa, the republican party received:
46.51 percent of the votes
25.0 percent of the seats
Here is another example of running your code:
What state are you interested in? Illinois
What party are you interested in? democrat

In Illinois, the democrat party received:
60.74 percent of the votes
72.22 percent of the seats
Part 7: Report
Ultimately, algorithms can only process a dataset and produce numbers; it is up to us to verify that the numbers are correct and interpret their meaning. In this last part, your task is to interpret the results of your analysis for three states: Florida, Wisconsin, and Minnesota. The question you are to consider is whether your analysis supports claims of gerrymandering in those states. You may find it helpful to review this Youtube video and the FiveThirtyEight article on gerrymandering.
In comments at the top of gerrymandering.py, write two paragraphs answering this question. Your answer should include both numerical results from your analysis as well as comparisons between those three states and others. If your answer is that your results don’t clearly support any conclusion about the presence of gerrymandering, that’s perfectly fine—just make sure to support your argument. I’m not looking for an in-depth essay here, just a demonstration that you’ve taken the important step in data analysis of engaging with the issue you are analyzing.
How to Turn in Your Code
- Once you are finished with the assignment, you should go to https://codepost.io and log into your account.
- Go to the CS 65 course.
- Go to Assignment 7 and upload all of your files.
- After you submit the assignment, you should be able to reopen it and see a Partners tab at the top of the submission page. Send the link to your partner and have them open it while logged in with their account.
- That’s it! You’ve just submitted your assignment.
Important Grading Criteria
I will evaluate your work with the following criteria in mind.
- Correctness. Does your code do what is asked? (e.g. named correctly, input and outputs correct values, etc.)
- Formatting. Is your code formatted so that it is easy to understand?
- Elegance. Is your code concise and elegant?
ACKNOWLEDGMENT:
This assignment was inspired by one written by Aaron Bauer at Carleton College.